Recently as a part of my dissertation project, we wanted to carry out a “Quantitative Polymerase Chain Reaction” (qPCR) experiment. This would allow us to measure the expression of specific genes in the plant under a stress condition, and compare that to the expression of the genes normally. This allows you to see if certain genes are up- or down-regulated in response to a stress.
We say a gene is expressed when it’s DNA is transcribed to RNA, and eventually translated to proteins which do things in the cell. This means if we can somehow figure out the concentration of RNA for a specific gene in a stressed plant compared to normal, we can use it as a readout for how much the plant is using that gene to deal with the stress.
Another important idea is that within the DNA sequence of a gene, only some parts are used when the RNA is converted to protein. These “coding regions” are known as exons. The sequences that aren’t needed are known as “introns”. After the DNA is transcribed to RNA, intron sequences get removed and the exons get stuck back together, producing what biologists call “mature RNA” (mRNA), which can then be translated into the protein.
In order to measure gene expression, you have to design primers. Primers are just short sequences of DNA which anneal to the sequence of your target genes. Then an enzyme can come along, and starts building more DNA off the end of the primer. A primer primes DNA synthesis. Without getting too much into the detail of qPCR (read a simple introduction here), the idea is for your primers to target the mRNA I mentioned earlier rather than the genomic DNA. The amount of sequence produced is proportional to the amount of mRNA made from the gene the primers bound, and we use fluorescently labelled DNA so that you can measure all this. So you need to make these “specific primers” that will target your gene’s mRNA (and not another genes) and, importantly for this article, the primers want to target mRNA- not the copies of the gene itself.
The Primer Problem
We wanted to design primers for some genes in the model plant organism biologists like to use: Arabidopsis thaliana (also known as thale cress). This plant is so cool it even has its own website.
How can we make it so that our primers target the mRNA, rather than the gene sequence on the genome? The ticket is that the mRNA has no introns, whereas the genomic DNA does.

Here’s our imaginary gene’s sequence. The bits highlighted in yellow are the exons- the parts that will be present in the mRNA. When the gene is transcribed, we’ll get a sequence something like this:
The red and green highlighted bits are where the exons were “spliced” together.
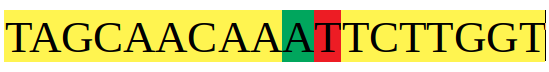
So what can we do if we want to target that second sequence, but not the first? We can design a primer that sits across that “splice point”, where the two exons were joined together.
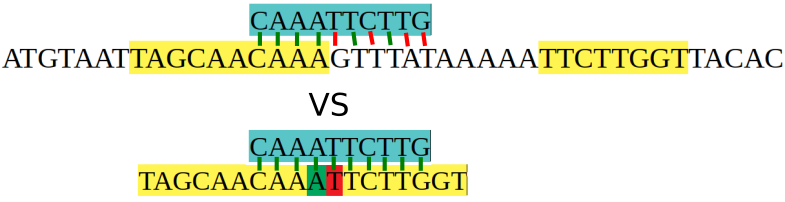
Now when our primer comes in to bind, it’s going to have a full match to the spliced mRNA sequence, but only a partial match to the genomic sequence. The biological reality is a bit different to the diagram I made, but the point still stands.
To make the most specific primers we needed to find out where these “splice points” are in the coding sequence of our genes- essentially if you glued all the exons together, where are the splice points for that gene?
Sounds simple.
We have three pieces of information.
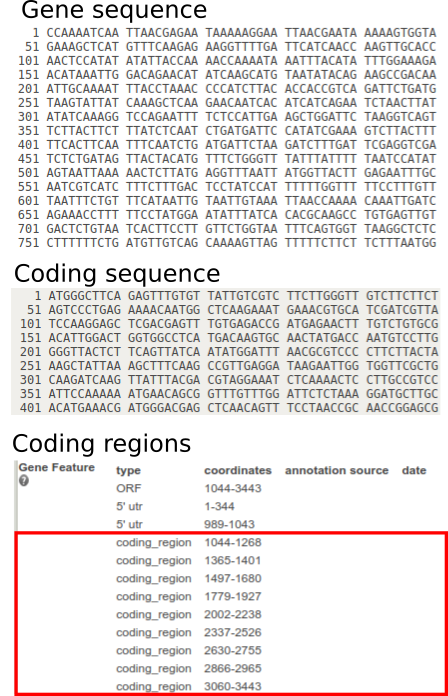
On TAIR, you get three pieces of information:
- The gene sequence.
- The coding sequence (the exons spliced together).
- The coding regions of the gene (the positions of the gene which are exons/used to make the coding sequence).
What we want to do is to use the information about the coding regions to find sequences in the gene that are at the edges of each exon. Then, we can search for the edges of the exons in the coding sequence, and identify the point at which the exons were spliced together. Finally, when we are designing our primers, we can look for ones which span this region.
In our lab, researchers generally did this process using a text editor like Microsoft Word, counting along the DNA sequences and doing the reformatting and cut/pasting by hand. Eventually you would have a coding sequence with all the splice points highlighted/identified on it.
As shown below, I wrote a Shiny app in R where you can feed in a gene’s sequence, the coding sequence and the coding regions. The app then does all the processing for you, and spits out a coding region with full stops present at the splice points. Here’s a link to the code if you’re interested.
Here are links to the GUS2 gene sequence, coding sequence and coding regions (under gene features) to try out for yourself.
(*Note: to enter the coding regions, you can copy and paste that specific part of the “gene features” table, or enter each number in order with a comma between them.)