Part 1: Setting the stage
Introduction
This project explores the language used in a Hansard from the EU withdrawal bill debate. It was motivated by a need to break down the rhetoric into what is important, and see how different groups of speakers within the Lords (whether these be groups from the same party, the same gender etc…) respond differently to the issues. What you’re about to read is really a proof of concept for how exploratory data analysis and text mining could be used to reinvigorate how we interact wiht information stemming from Parliamentary debates. The analysis was done using the R programming language and tidy data principles, and this webpage is written using R markdown. Later posts will be strongly inspired by a book on text-mining in R by Julia Silge and David Robinson.
Why not just read the debate? I strongly recommend you do indeed read the debate itself. However, text analysis is powerful for several reasons. Firstly, it is time consuming to read a 12 hour debate the whole way through. Secondly, there is simply too much information contained within the debate for a single human mind to efficiently spot all the patterns present. Text mining offers a way to explore and summarise these patterns and ideas.
That is not to say text mining is without problems. By definition, when we summarise the text in some way, we lose information. For example, by counting words and phrases in the text (a prerequisite to many analytical methods), we remove information connected to the grammar and context of each sentence and paragraph. However, by asking questions that are clear, transparent, and meaningful and being measured about the conclusions we draw, text mining approaches can yield insights that would otherwise be inaccessible. As well as informing people about the Brexit debate, this series of articles also aims to showcase the huge amount of information that can be found in a single structured text file.
Be sure to use the glossary at the bottom of the page when you haven’t heard of a term before. If you want to read more about the debates in the Lords or Commons, go to the Government’s official website https://hansard.parliament.uk/ or take a look at some of the brilliant work being done at https://www.theyworkforyou.com/
Counting things that matter
In this article, setting the stage, I would like to give an overview on what we can expect to find out from text mining an individual Hansard and introduce the tools and ideas that will be used in later analyses.
A Hansard, which is really just a transcript of a debate held in Parliament, is a structured piece of text. Text is organised chronologically into speeches given by each peer/MP- not unlike the script for a play. What is the relevance of this to our analysis? It turns out that this structure allows us to access lots of information which is separate from the text itself. So our first big question is: What can we measure?
Here are some examples before we move on:
- Which MPs spoke in the debate.
- How often each MP spoke.
- What order MPs spoke in.
In the house of Lords, each speaker’s name is prefixed by a title- Lord, Baroness, Lady, etc… From this we can infer the gender of the peer. We can also extract their party (provided next to their title). If we wanted to, we could even search for external metadata such as age, or Alma Mater, but for now we will stick exclusively to what we can gleen from the Hansard itself.
We are starting to build up the backbone of our analysis. To make things clearer, here is a diagram:
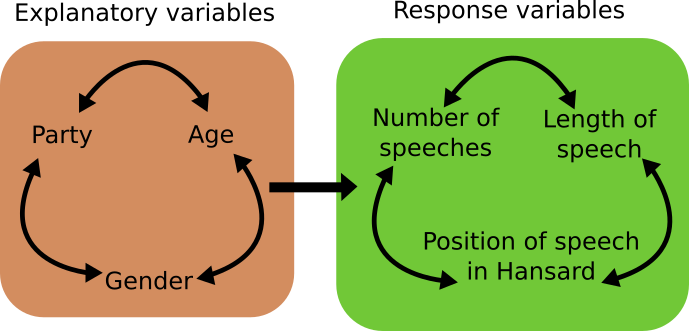
Explanatory and response variables within a Hansard text.
There is information in the Hansard which we might try to use to explain other data in the Hansard. There are lots of terms for this in statistical lingo but we will say there are explanatory variables which can be used to understand patterns in response variables. Put in context, there might be differences in the number and length of speeches of MPs from different parties, or of different genders. There is also likely to be assocations between some of these factors themselves- different parties will have different proportions of speakers from each gender. Which patterns are meaningful and interesting, and how to separate out the effects of this interacting network of variables, we will come to later. But for now appreciate the depth of things we can look at without even digging into the nature of the text itself.
Before we look at the text data itself, we need to get our bearings. We will begin by visualising who was present, and counting the number of speeches made by different groups of peers.
Who turned up?
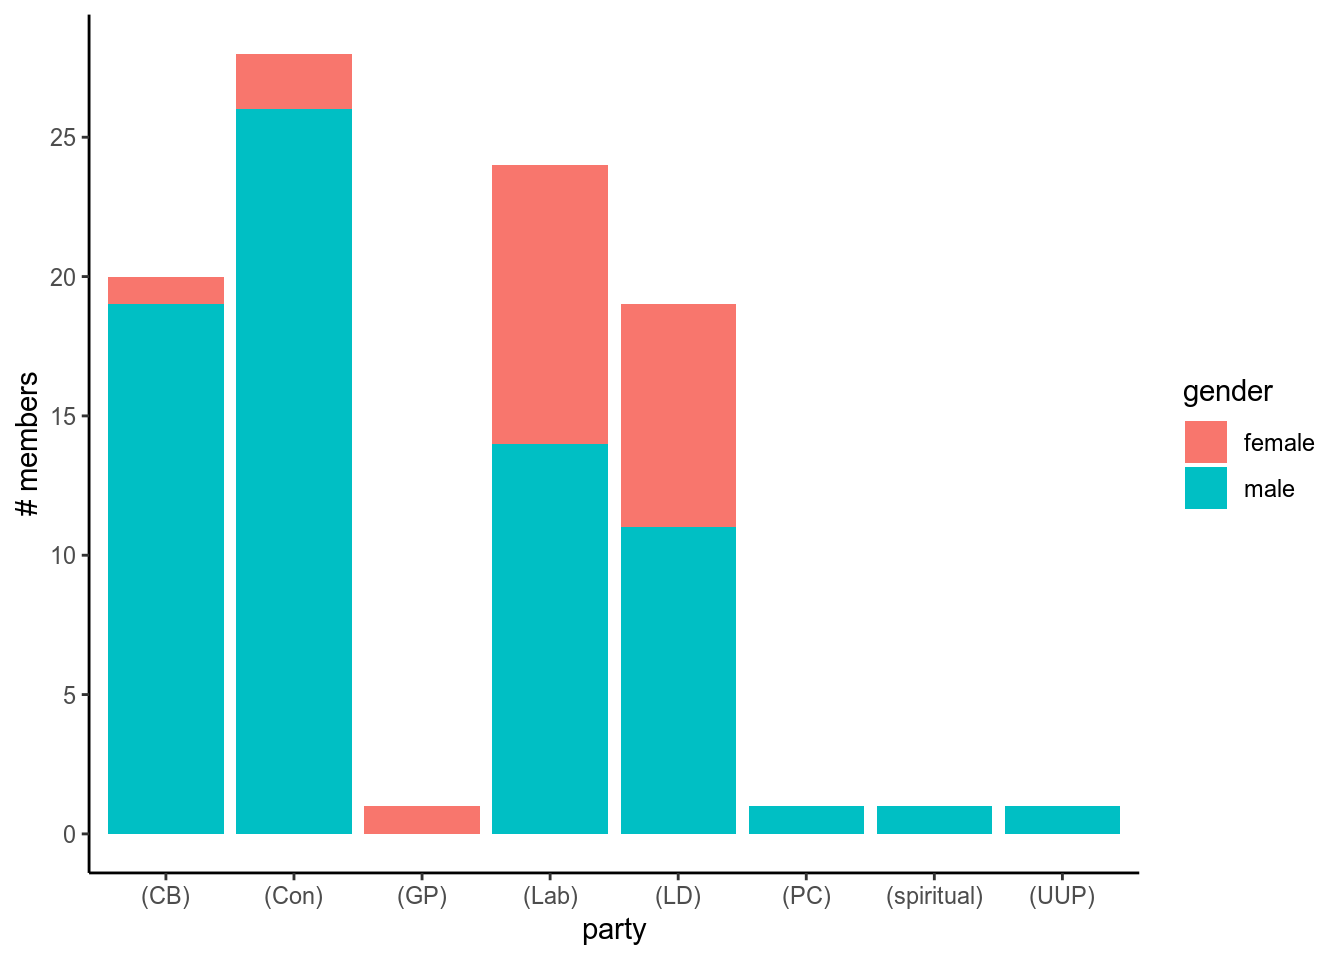
Figure 1: CB=crossbench, GP=green party, PC=Privy council, UUP=Ulster Unionists Party
This figure shows that the majority of MPs belong to the three major parties or crossbench, and that the faction with the most MPs present are the Conservatives. I have also coloured in the bars to indicate the proportion of male versus female peers in each party. Needless to say, the vast majority of female representation in the house comes from Labour and the Liberal Democrats.
To get this data, we have just counted up all the unique speakers, and recorded their party and gender using information from the headers.
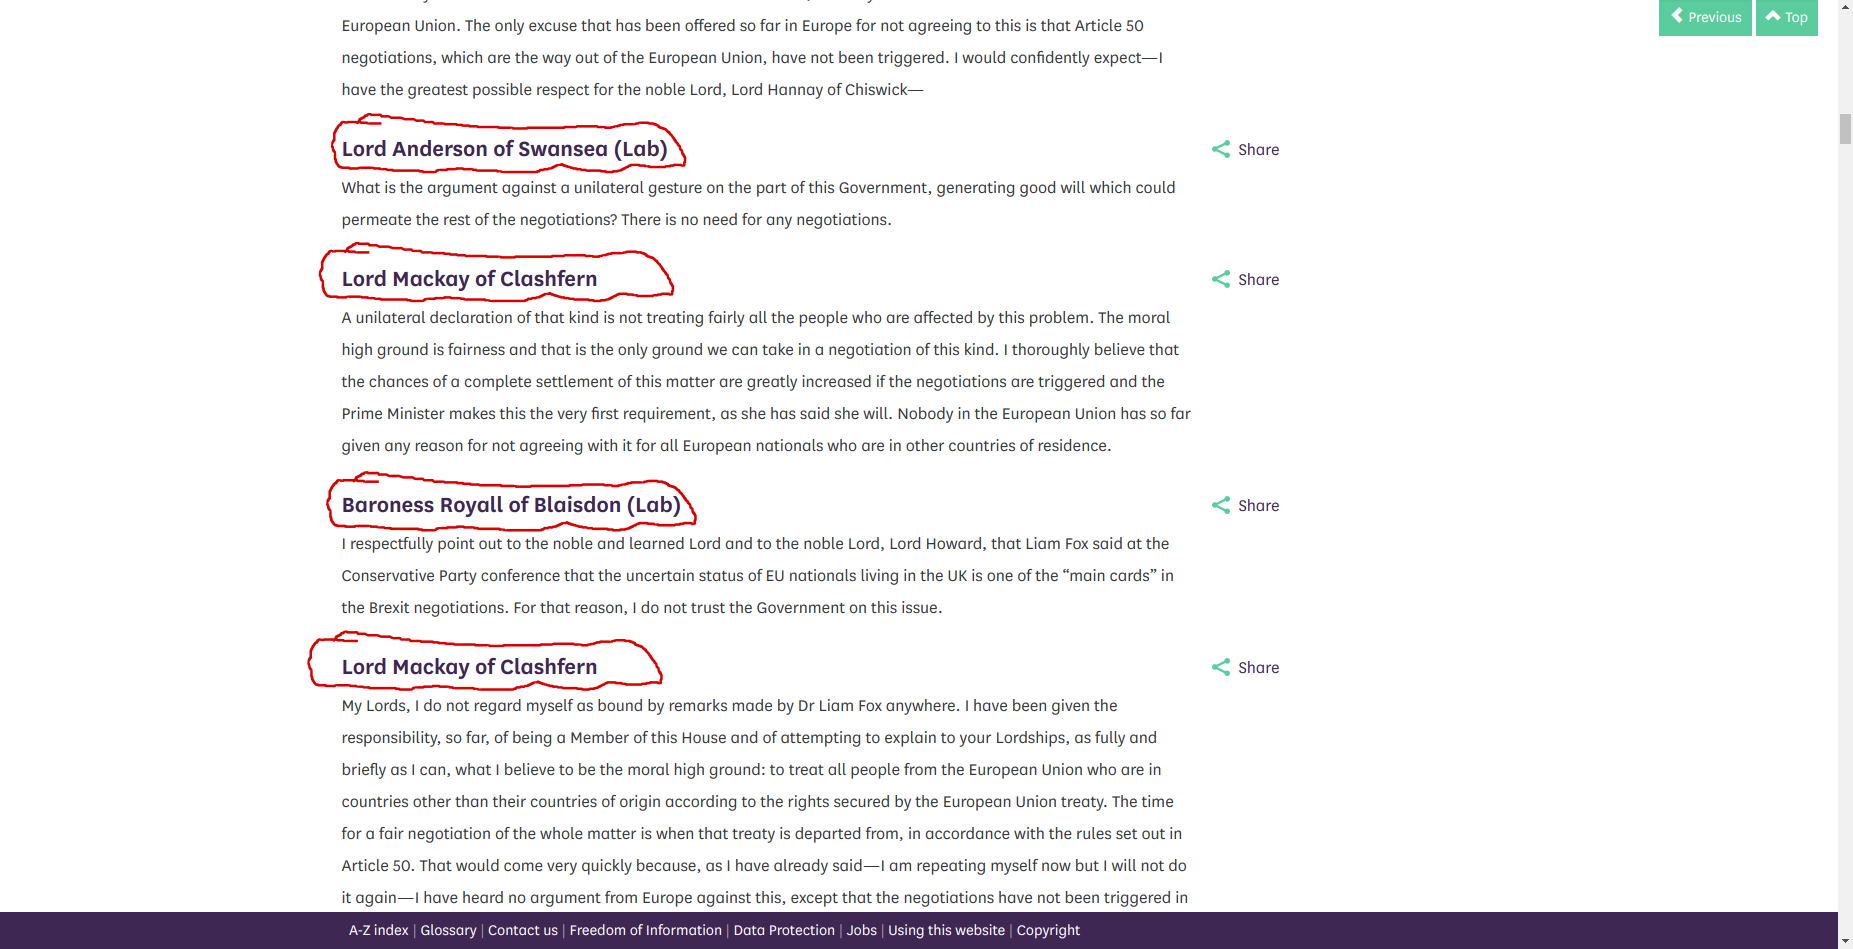
The Hansard text as it appears on the Parliamentary Hansard website.
A more robust system might combine this scraping with the use of a curated database of current MPs and their associated information, but I’m trying to work exclusively with data from the Hansard for now. This actually touches on a general point I would like to elaborate on in a later article. A publically maintained and curated database could make this process much easier and more accurate. It would cost little to implement and maintain for a voluntary group (or even paid civil servants). The point is, although the Government is getting better at sharing data, there is a general failure to make the data that is shared adequate for research or computational analysis. It’s a kind of quasi-transparency. Simple structures could be put in place to streamline available data into standardised, tidy, well-organised file formats. Instead we often see MPs accounts uploaded as PDFs of scrawled, handwritten receipts; no system to download large batches of available files; or a popular one is publishing a spreadsheet of the processed data, but not the raw data. We are lucky in this case to have access to a plaintext file and not have to web scrape the Hansard for ourselves.
Which MP or group of MPs spoke most often?
The next interesting thing to look at might be which party is making the most speeches.
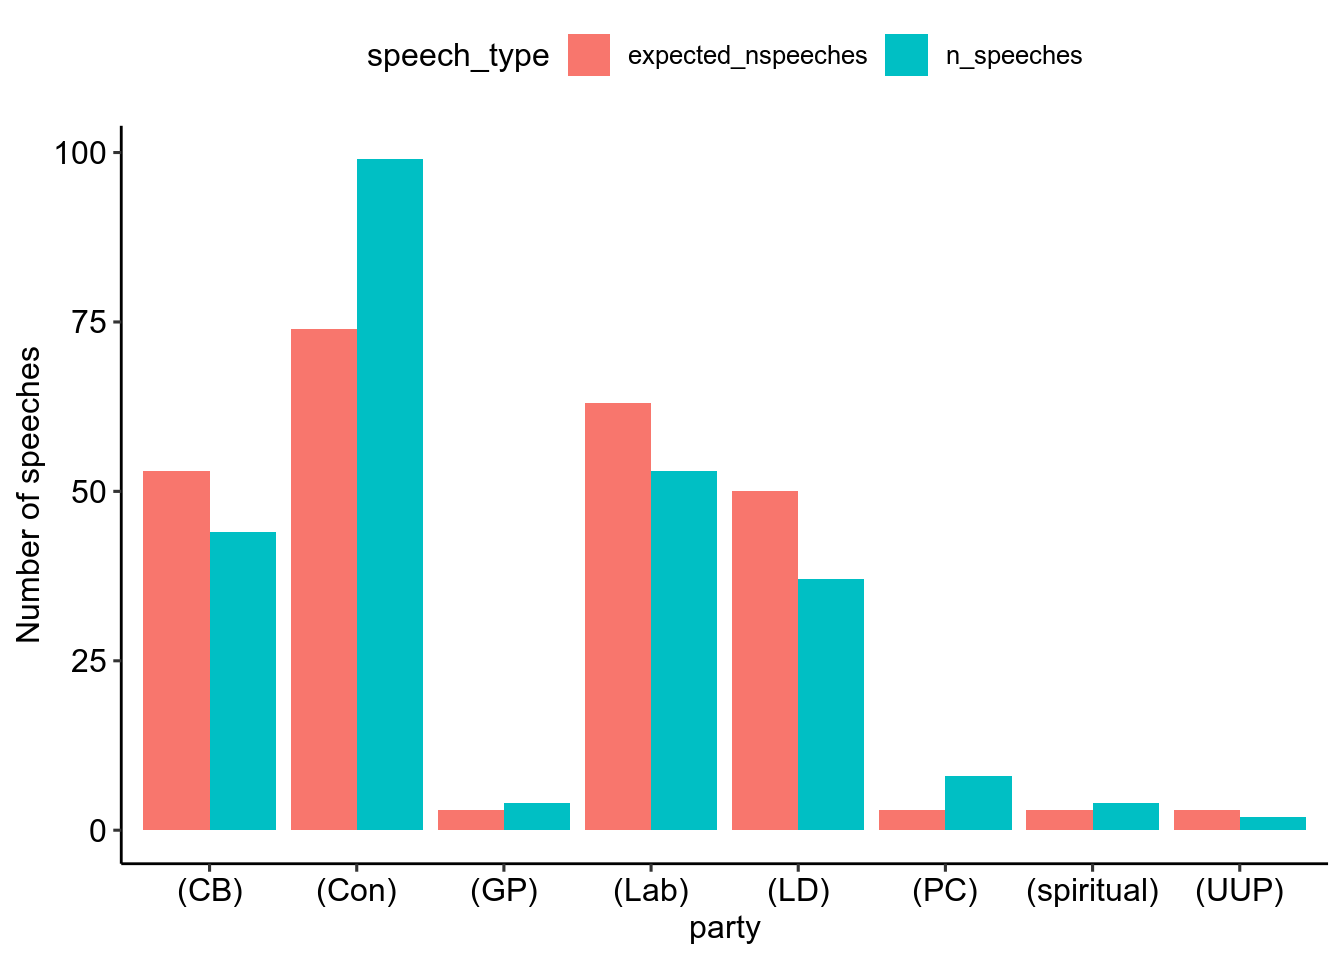
Figure 2: The red bars are the expected number of speeches, the blue bars are the number of speeches that were actually made.
We first count the number of appearances each individual made in the Hansard. When considering different groups of speakers (for instance, the Labour party vs the Conservative party), it is important to remember that each group is present in different numbers. This affects how we think about the results, for example: if the conservatives have 4% more speakers than the labour party, we would expect to see them give 4% more of the speeches.
However, even taking into account the disproportionate numbers of speakers present for each party, the Conservatives still speak more often than we would expect. This in turn means that other parties spoke disproportionately less often than what would happen if speeches were perfectly fairly distributed among each group present. To summarise, the Conservatives had more Lords, and still made more than the their fair share of speeches. Number of speeches given is not independent of political party (chi_sq = 24.3, df = 7, p < 0.05).
Example calculation: There were 28 Conservative MPs and 95 MPs in total, 28 / 95 = 0.29 so 29% of the speakers present are Conservatives. If there were 251 speeches throughout the day we would expect 0.29 * 251 = 73 speeches to be given by Conservative MPs.
In reality this number was closer to 100. Let’s look into this in more detail…
## # A tibble: 95 x 3
##    name                            n_speeches party
##    <chr>                                <int> <fct>
##  1 Lord Howard of Lympne                   12 (Con)
##  2 Lord Taylor of Holbeach                 12 (Con)
##  3 Lord Bridges of Headley                  9 (Con)
##  4 Lord Keen of Elie                        9 (Con)
##  5 Lord Oates                               8 (LD)
##  6 Lord Wigley                              8 other
##  7 Baroness Hayter of Kentish Town          7 (Lab)
##  8 Lord Hannay of Chiswick                  7 (CB)
##  9 Lord Tebbit                              6 (Con)
## 10 Lord Bilimoria                           5 (CB)
## # … with 85 more rows
Here, we have counted the number of speeches made by each MP. We can look through the table for patterns at a glance (some might already notice one pattern), but what does this data look like as a whole?
Figure 3

Figure 3: The distribution of speech numbers coloured by party.
Figure 4
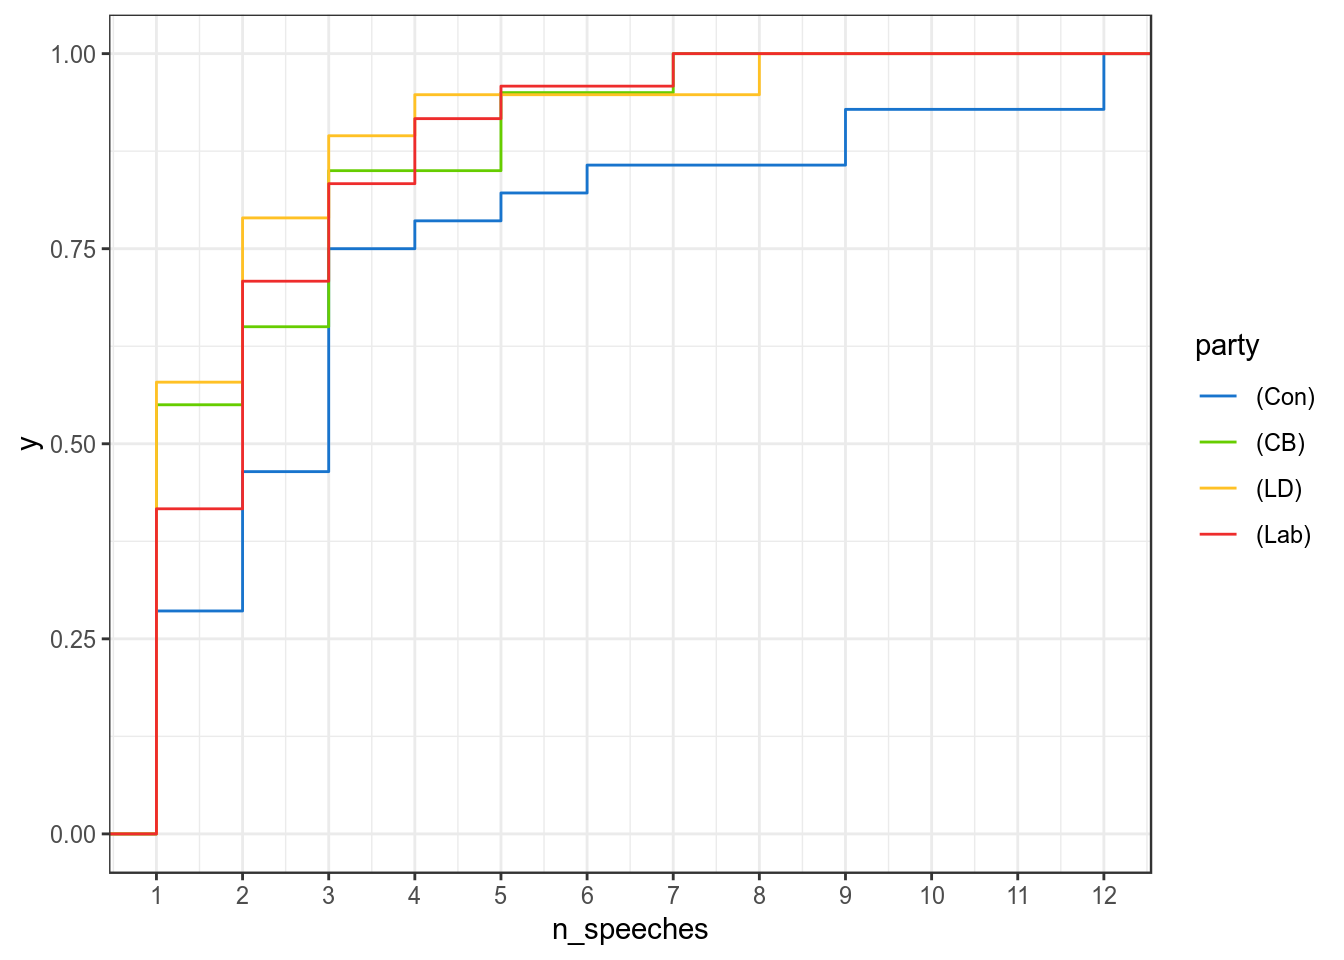
Figure 4: The distribution of speech numbers as an empirical cumulative distribution function.
Most MPs made one speech (about 40%), and only a little over 20% of the MPs made more than three speeches (19 of 93 Lords). We know that Conservatives made more speeches than expected- but where did they make these gains? Did they just have one or two Lords that made large numbers of speeches, or did most Conservatives just speak a little bit more often. Within the distribution of Conservative Lords, this difference seems to be driven not only by the tail of the distribution (a small number of Lords who spoke a lot), but also by a group of Lords of who made three speeches- Conservatives making up half the Lords of this group. Conservative Lords made a median of 3 speeches in the session, more than the median number of speeches made by either Labour, Lib Dem or CB Lords (2,1 and 1 respectively). In summary, not only do a small number of Conservative Lords control the far tail of the distribution, your average Conservative weighs in more often than your average peer from any other major group, even in spite of them having more speakers to begin with.
Notice in figure 2 that the ECDF of the Conservative party sits to the right of the other parties, meaning that for any given “number of speeches” the probability of a Conservative making that many speeches or less is higher than for Lords in other parties (based on the same data as our bar chart).
Going back to the Hansard, Lords speak in sequence (to state the obvious). The order in which Lords speak is something we will look at in much more detail in a later post, but for now we will check two things. Firstly, how often do Lords from the same party speak consecutively? And secondly, can we say anything about which parts of the day were most important to each party- with what parts of the text did each party engage most?
## # A tibble: 4 x 4
##   party     n   tot     p
##   <chr> <int> <int> <dbl>
## 1 (Con)    22    36  0.61
## 2 (CB)      7    36  0.19
## 3 (Lab)     5    36  0.14
## 4 (LD)      2    36  0.06
This table shows the number of times a pair of Lords from the same party speak consecutively in the text. More Conservative Lords are present and speak more often, so we would expect them to form more pairs. How can we get some idea of the base level of expected clumping given the number of Lords- what distribution do we assume is “normal”? The only thing I can think to do is compare how likely each group is to appear alone, compared to how likely they are to appear together. There are 72 instances of a Conservative Lord speaking singly, and 22 consecutively, so 22/(22+72)=0.23. For Labour this is 5/(5+45)=0.1. For Conservatives, every 4-5 speeches made are paired/consecutive, for Labour, only every 10 speeches they make are made consecutively. This compounds with the fact that Conservatives make more speeches in general.
Figure 5
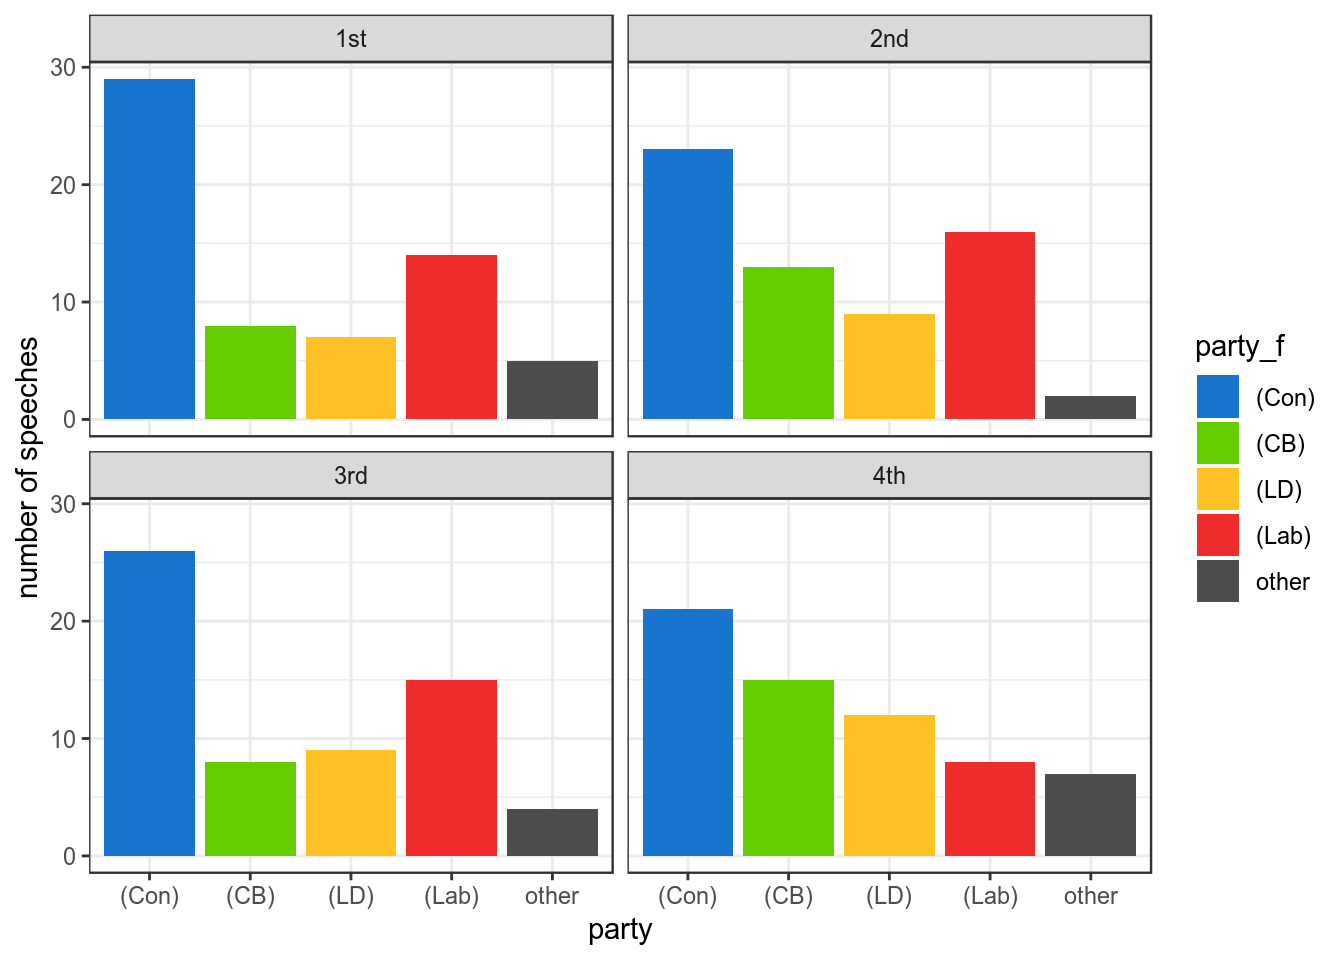
Figure 5: Number of speeches in each quarter (panel) of the Hansard.
Figure 6
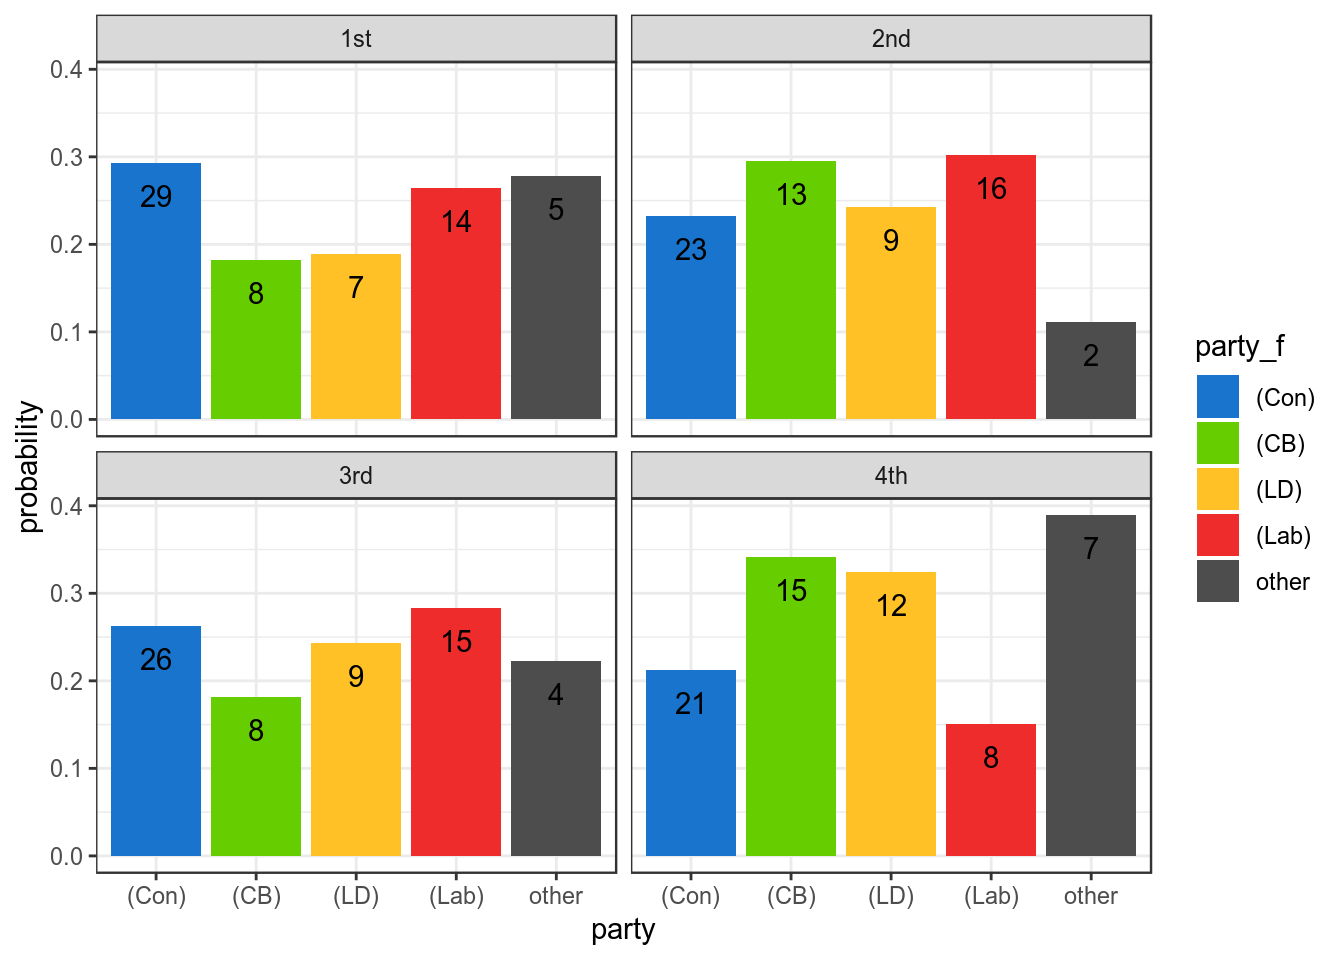
Figure 6: As above but y values are speeches as proportion of total speeches made by each party.
Above, I have arbitrarily split the days speeches up into quarters. This should give us a general picture of whether a party’s speeches are spread evenly throughout the day or whether some parties dominate at one point, and others dominate other times. In the first figure, I have plotted the raw number of speeches, and in the second figure the number as a fraction of all the speeches made by that particular party. If speeches were perfectly evenly distributed in each quarter, they would approach 25% in the second figure. Conservatives notably control every quarter, but their speeches are largely evenly spread throughout the day. Labour notably makes less speeches later in the day, where CB, LD and minority groups make more input.
Discussion and future topics
There are several ideas I hope to have got across in this piece. The first is how important the context is for each statistic. Often, the most important details are the ones which are left out. For example, we could easily look above and quote the fact that the Conservatives make the most speeches. But if we also know that they have more Lords, the meaningfullness of this information on its own is called into question. We have to question our own assumptions and say- even though these people speak more, to what extent do they do that compared to what we would expect?
There is really a lot to say about what looks like quite a simple piece of data. There is probably yet more to say, and even though we might feel now like we have seen the whole picture, the likelihood is that our conclusions don’t stretch as far as we think, or that there are multiple possible explanations. I investigated the idea that Conservative Lords speak more than their fair share, and speak consecutively more often to one another. This is all true. But understanding the reason for this is more difficult and might requires further information.
We might like to think conspiratorially that this is some ploy to control certain aspects of the debate. Maybe. But other explanations arise naturally from how the debate operates. For example, each party has a whip. There are more Conservative Lords, so their whip intervenes more often. This multiplies the number of consecutive speeches we see for the largest party, even though it is a natural outcome of having more speakers. In my second figure, I assume that you can calculate the expected number of speeches in a directly proportional way to the number of Lords. But this might not be the actual relationship. It might be that there is some compounding effect which means that a group with two times more lords than another makes triple, rather than double, the number of speeches. In this case, it is not a “Conservative Party” problem, but something that would affect any large group present. Indeed, drawing attention to the party at all may be a false flag, especially in the House of Lords where MPs act more independently. We have also seen that the Conservatives have less female MPs. This may in some way influence the frequency of speeches made. Ultimately, to really understand the patterns we see, we need to do controlled experiments. But the fact remains that in this discussion, one group spoke much more than the others and this may be a point requiring further investigation. The pieces of evidence in the article combined allow us to evaluate and criticise our political system, so long as we are careful about our interpretation.
In the next part, we will dig into the actual text of the Hansard. Here is a link to the github page for this project if you’d like to look at the code.
Glossary
Crossbench (CB)
Crossbench Peers are non-party political and by tradition sit on the benches that cross the chamber of the House of Lords. source
Privy Council (PC)
A collection of senior politicians who are or have been members of the House of Commons or House of Lords. source
Whip
Whips are MPs or Members of the House of Lords appointed by each party in Parliament to help organise their party’s contribution to parliamentary business. source
Hansard
A Hansard is the official transcript of proceedings of both the House of Commons and the House of Lords. It is named after Thomas Curson Hansard (1776–1833), a London printer and publisher, who was the first official printer to the parliament at Westminster. source
Peer
A peer is just a member of the House of Lords (like an MP in the House of Commons) source